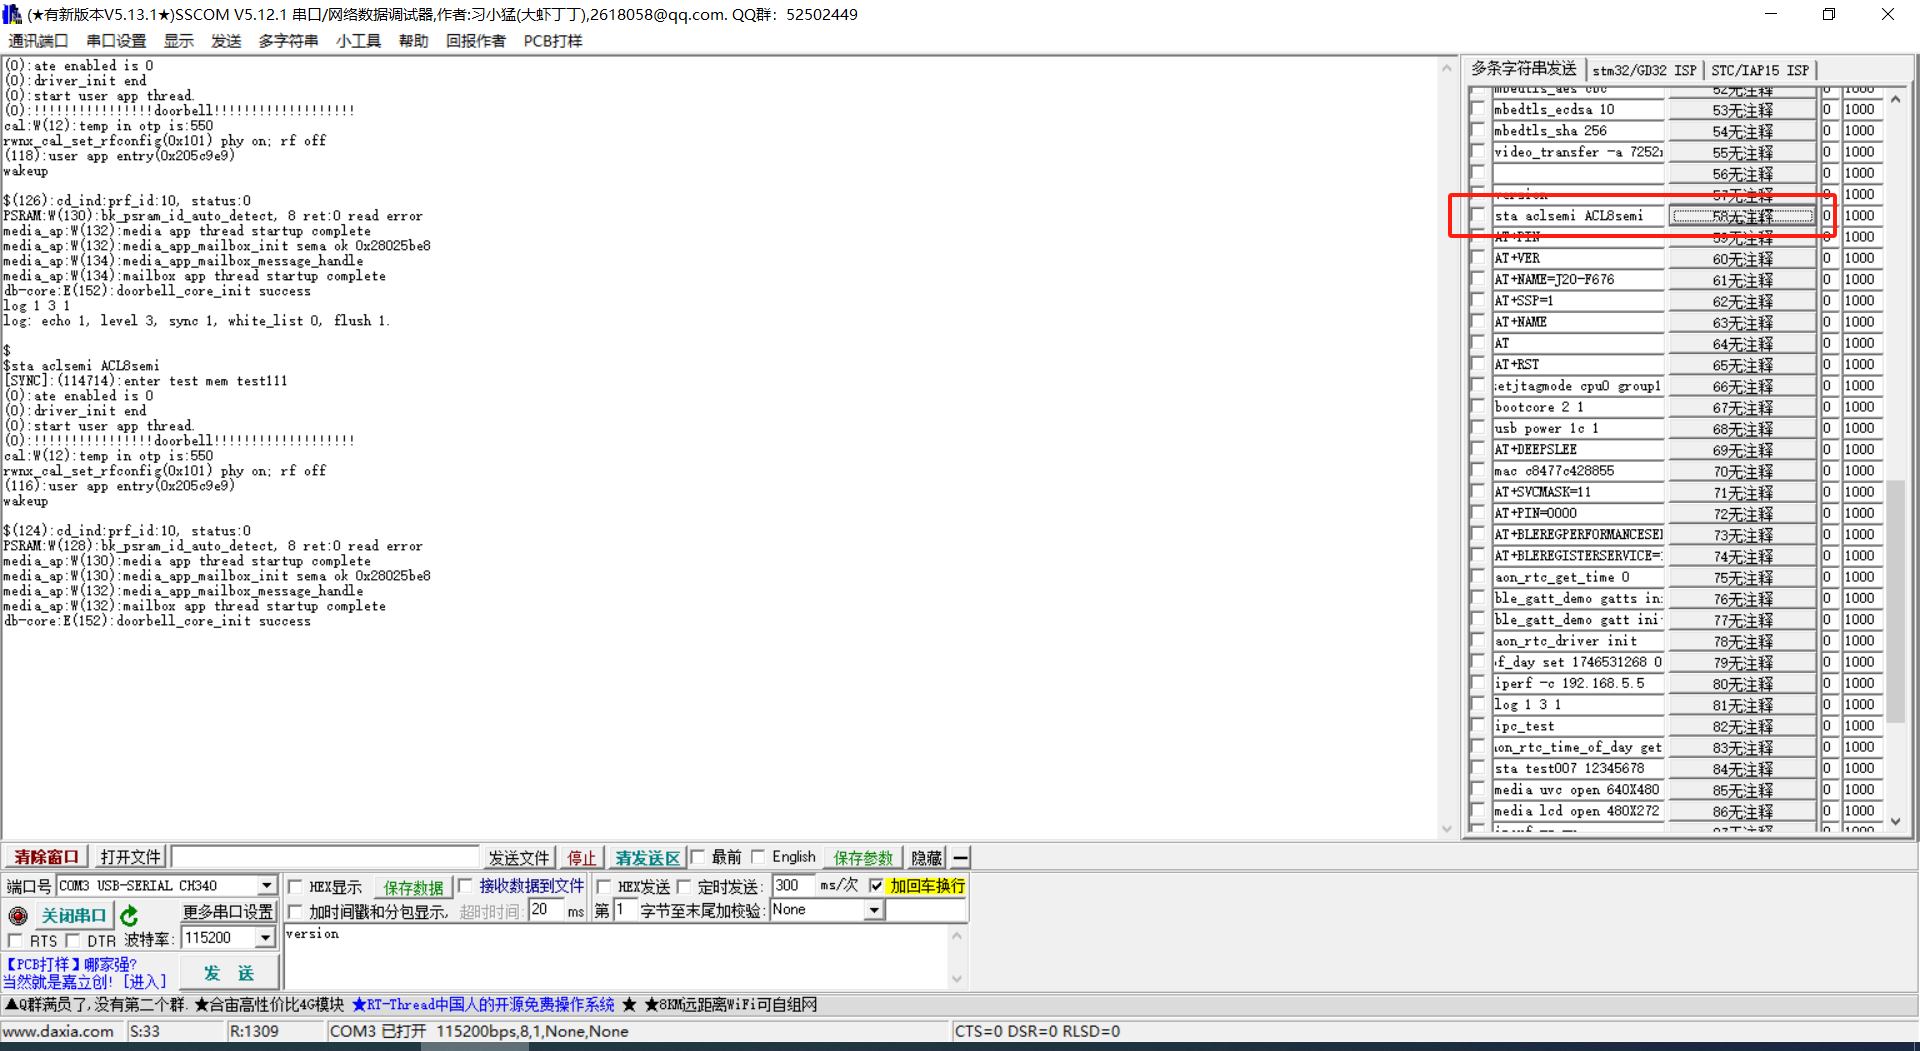
The log of BK7258 CPU0 is output through the serial port DL_UART0 (default baud rate is 115200)
BK7258 CPU1 log is forwarded to CPU0 serial port DL_UART0 output through mailbox (default baud rate is 115200)
The log of BK7258 CPU2 is output through the serial port UART2 (default baud rate is 115200)
By macro CONFIG_SYS_PRINT_DEV_MAILBOX=n,CONFIG_SYS_PRINT_DEV_UART=y,CONFIG_UART_PRINT_PORT=0
you can change the output mode of the log of CPU1 (the above setting is that the log of CPU1 is output through UART0)
note CPU0 is the main core, and there is no MailBox channel between CPU0 and CPU2, so only CPU1 is supported
CPU1 log has cpu1 label (except exception log)
Due to memory buffer limitations, the number of bytes of each log data must be less than 128 bytes. Logs exceeding this size will be discarded by the shell module and a message !!some LOGs discarded!! will be output. If there are too many logs and there is no time to output them, causing log accumulation and the buffer is used up, this prompt string will also be output.
Enter the log command through the serial port to view the current log configuration
Enter the help command through the serial port to view the currently supported debugging commands:
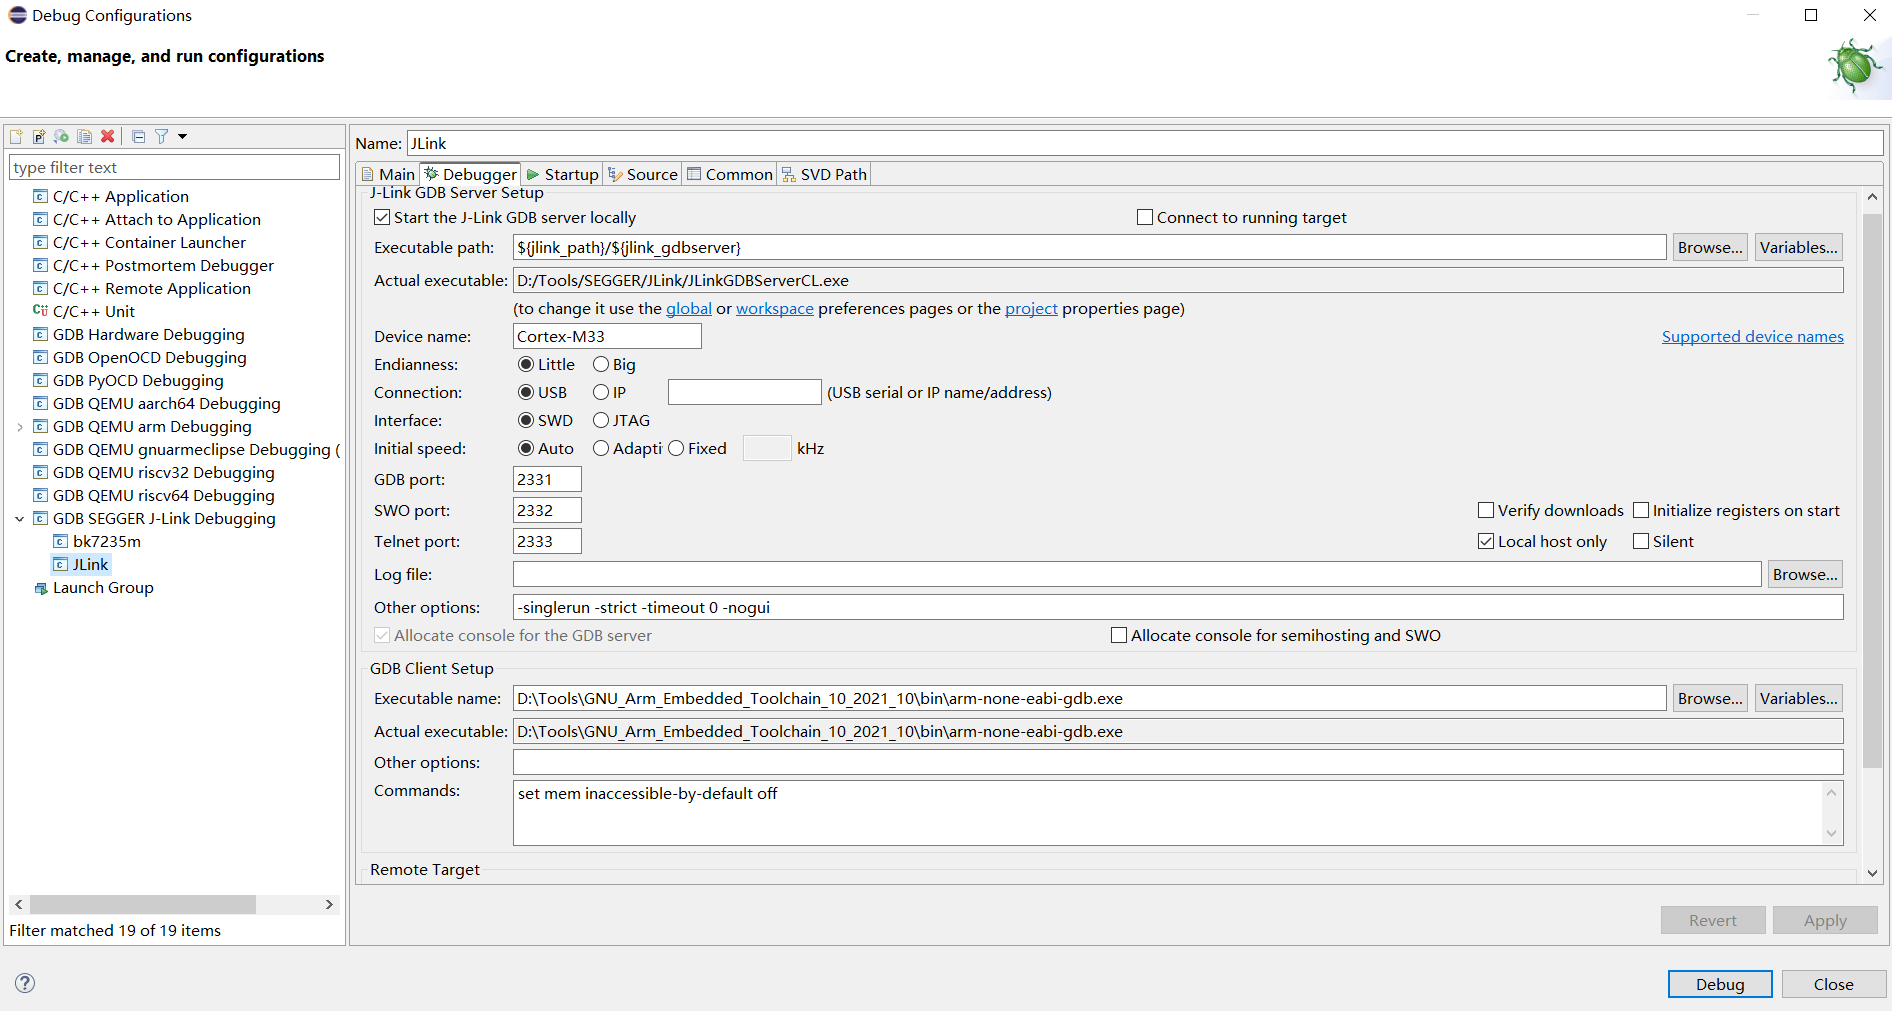
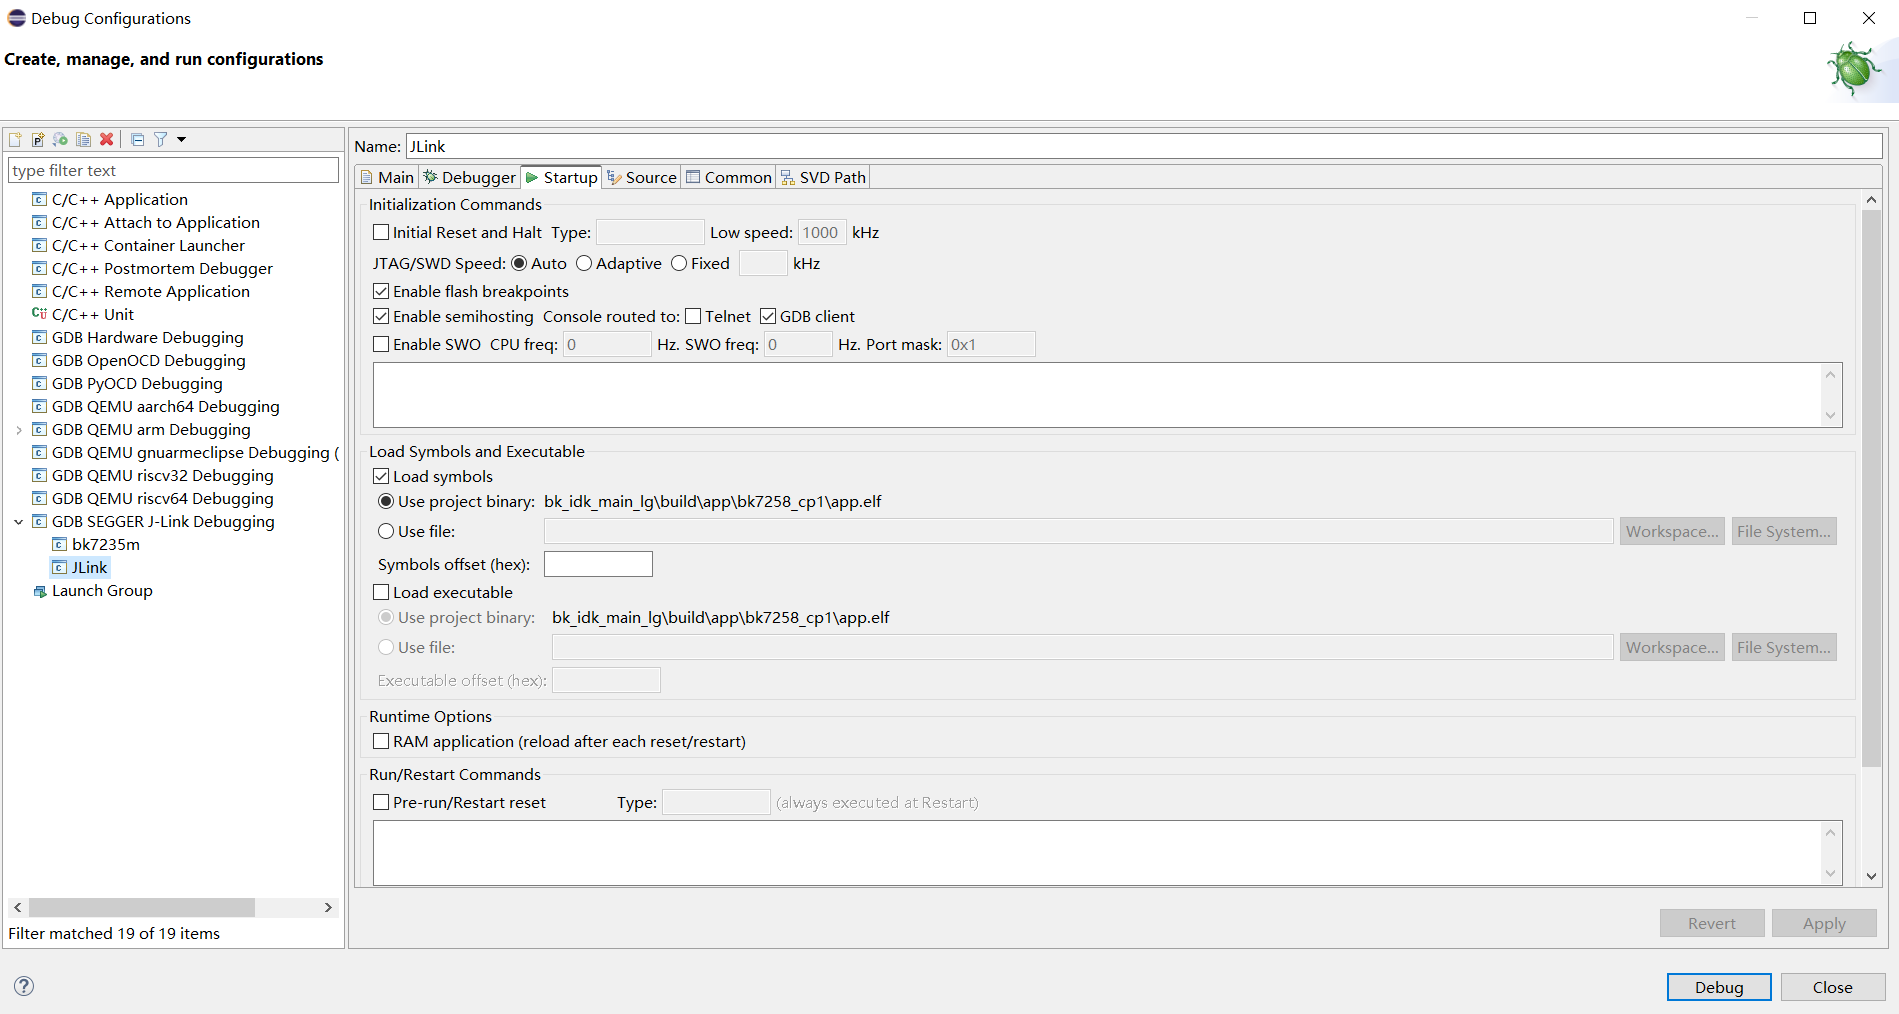
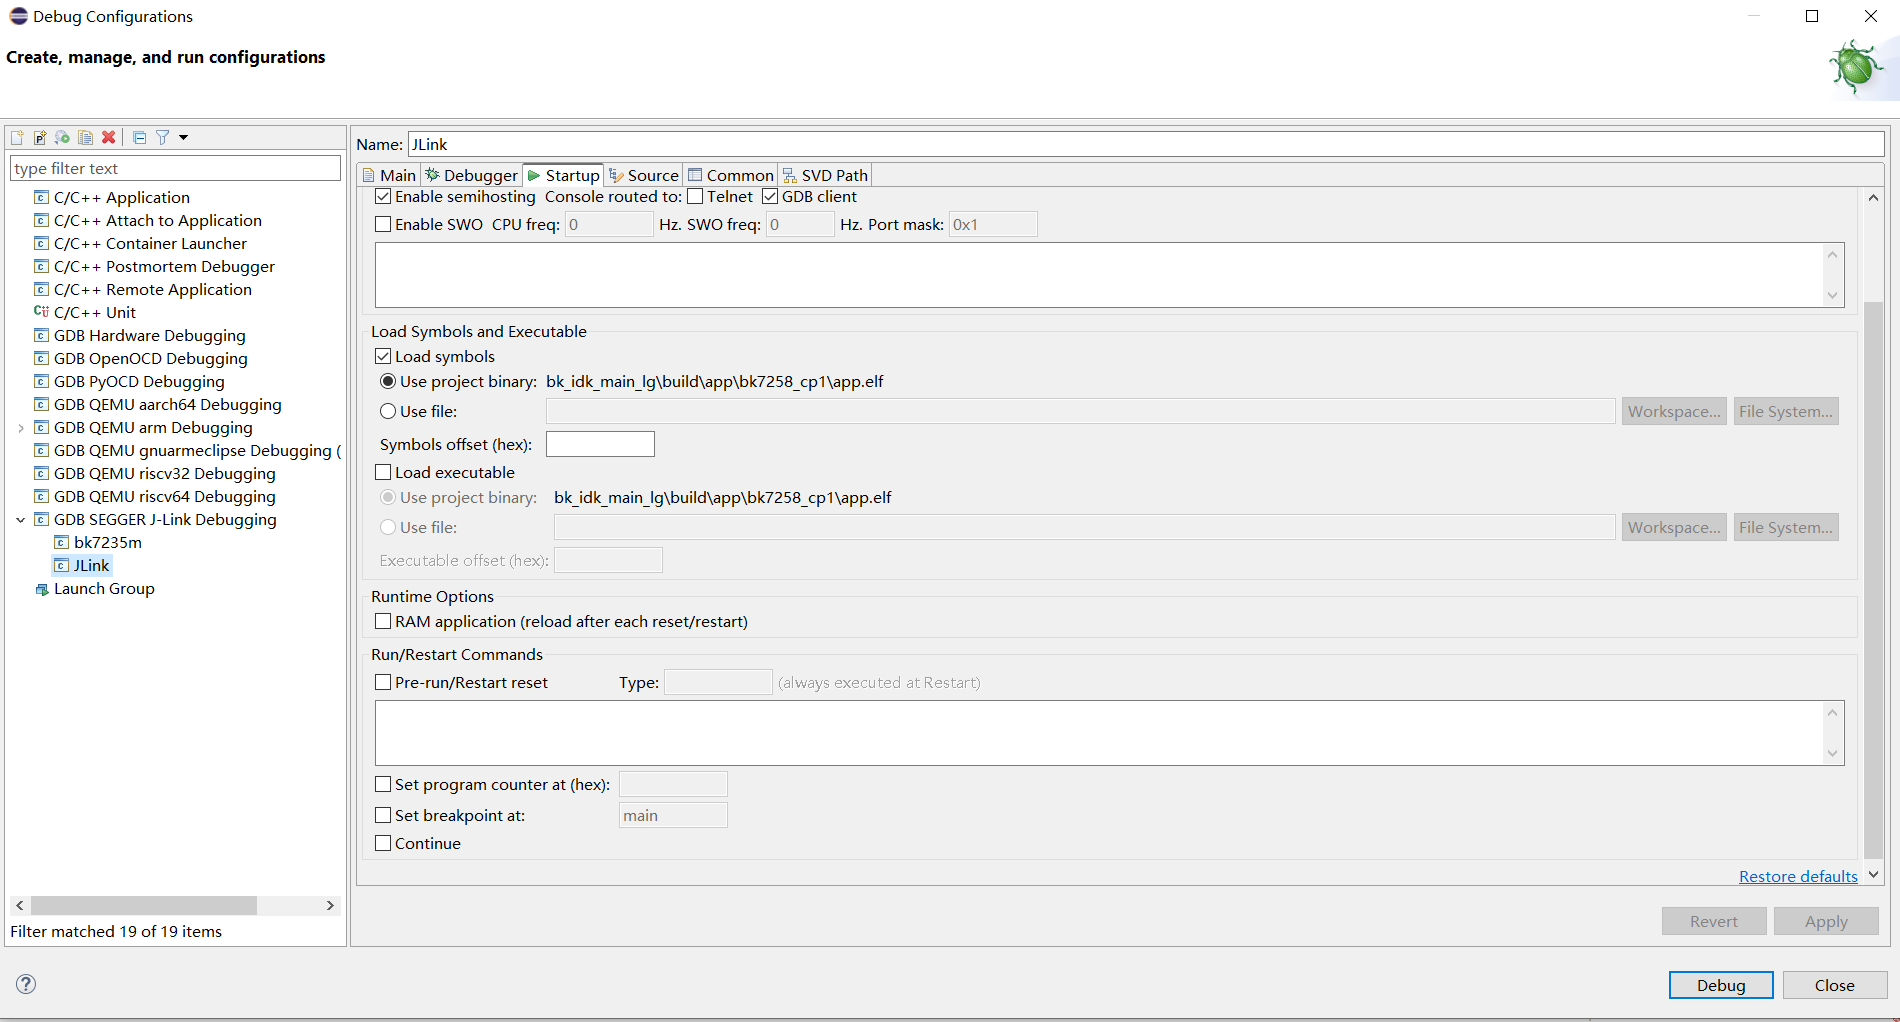
Eclipse version
eclipse-embedcpp-2020-12-R-win32-x86_64.zip
Eclipse project configuration
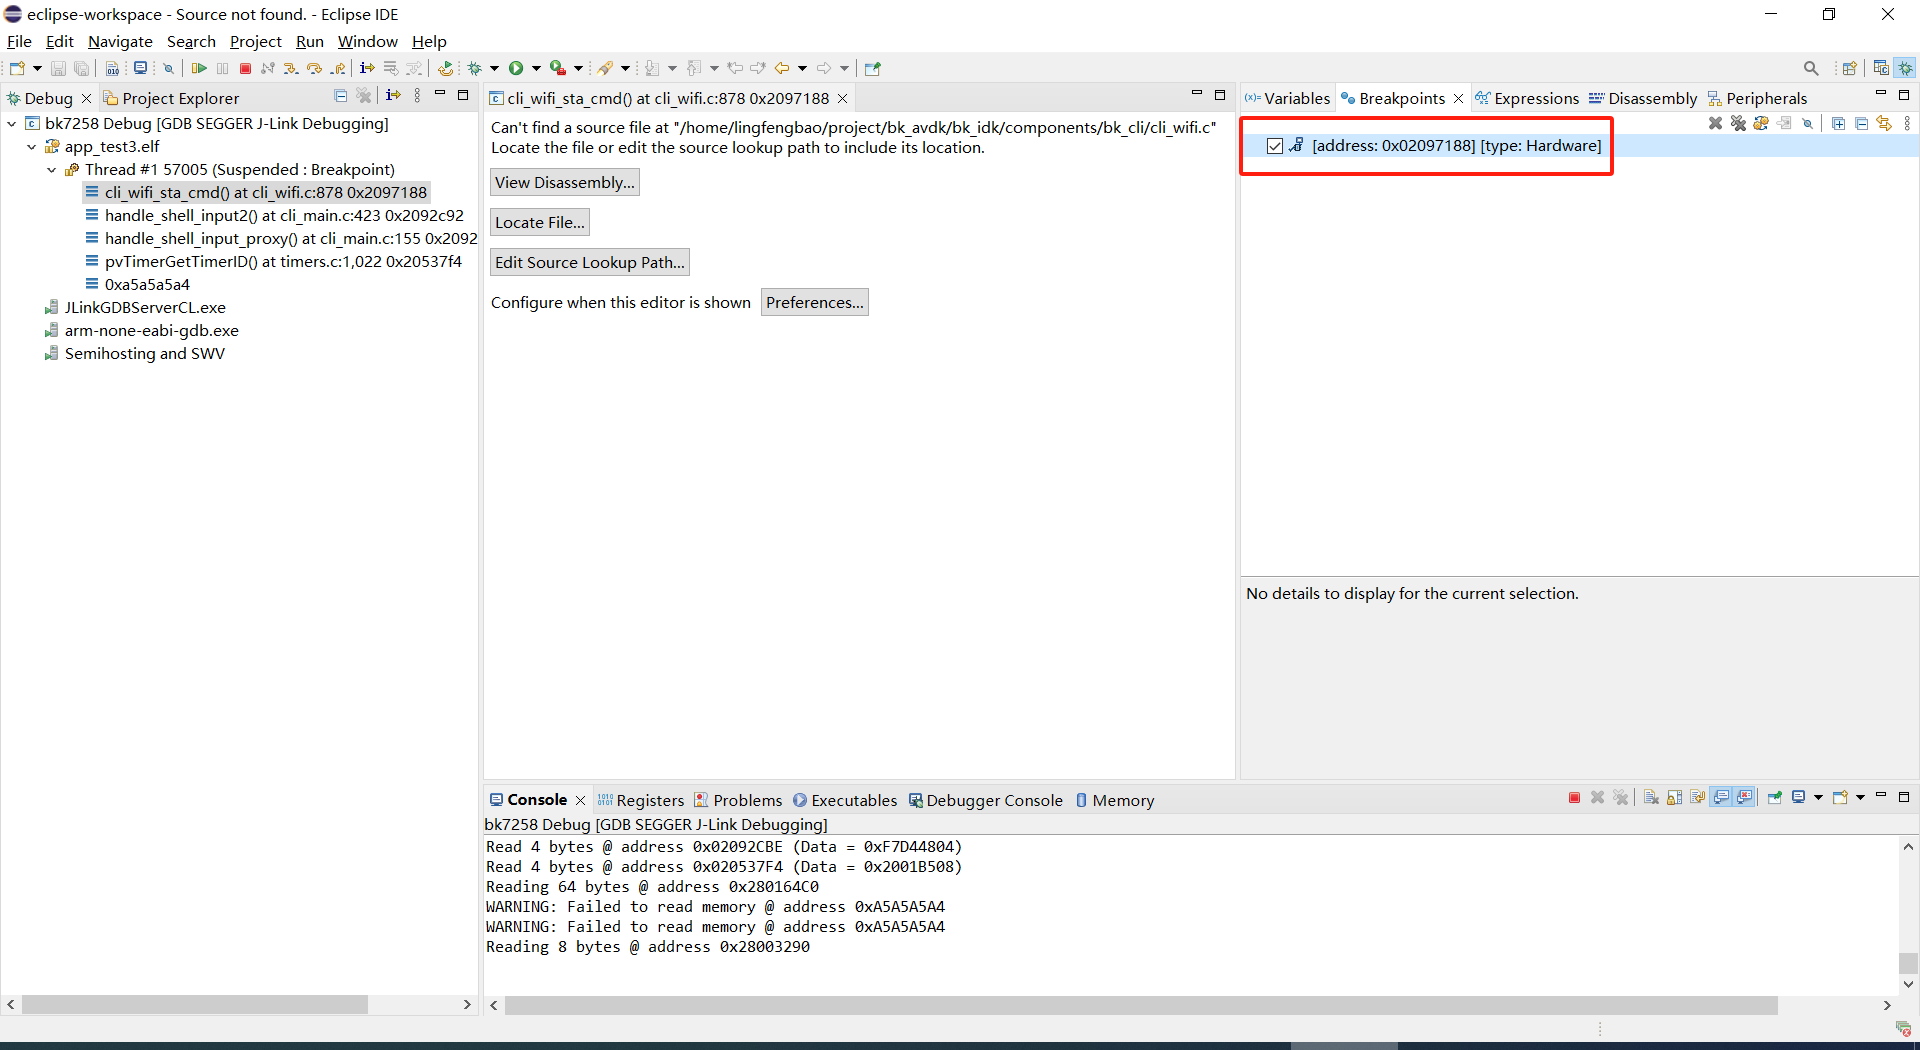
The default jtag is connected to cpu0, and BK7258 has two Jtag ports (grou1/group2)
You can set jtag connection cpu0 through the setjtagmode cpu0 group1 command
You can set jtag to connect cpu1 through setjtagmode cpu1 group1
You can view the current jtag status through the jtagmode command
Note
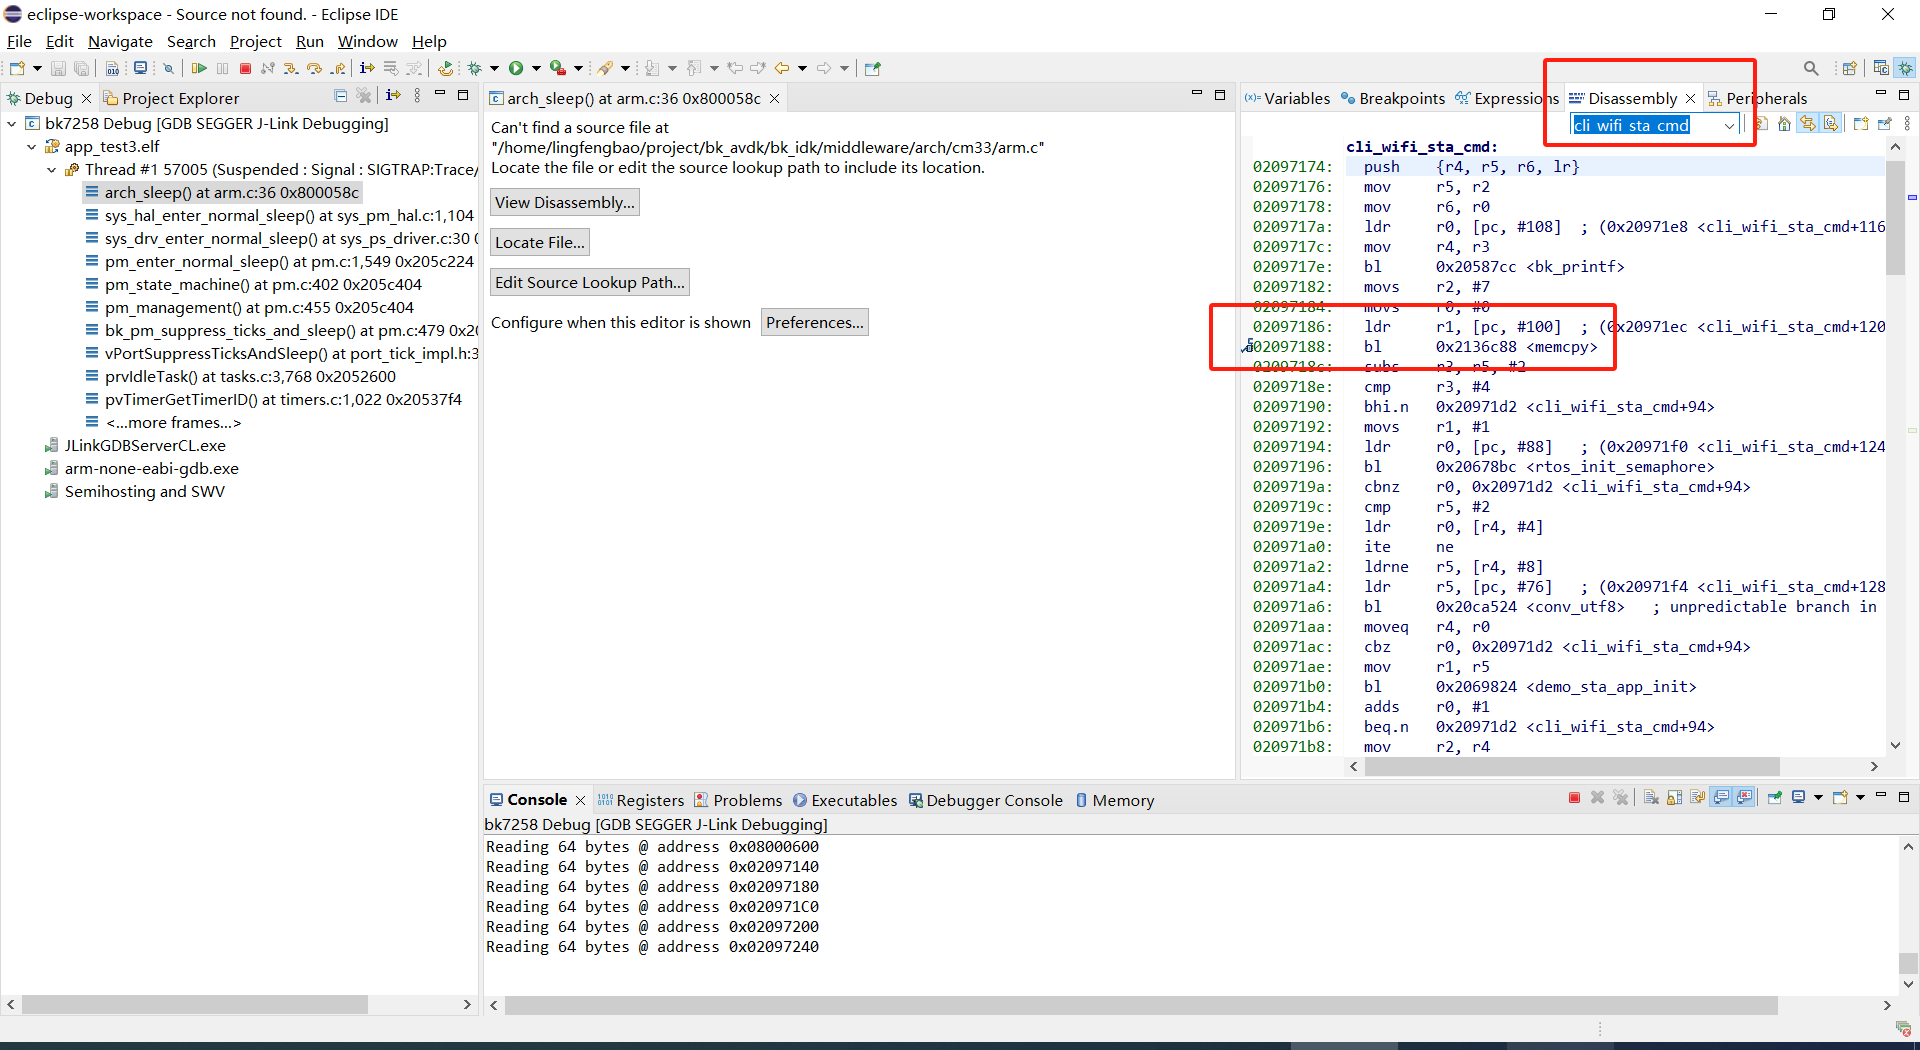
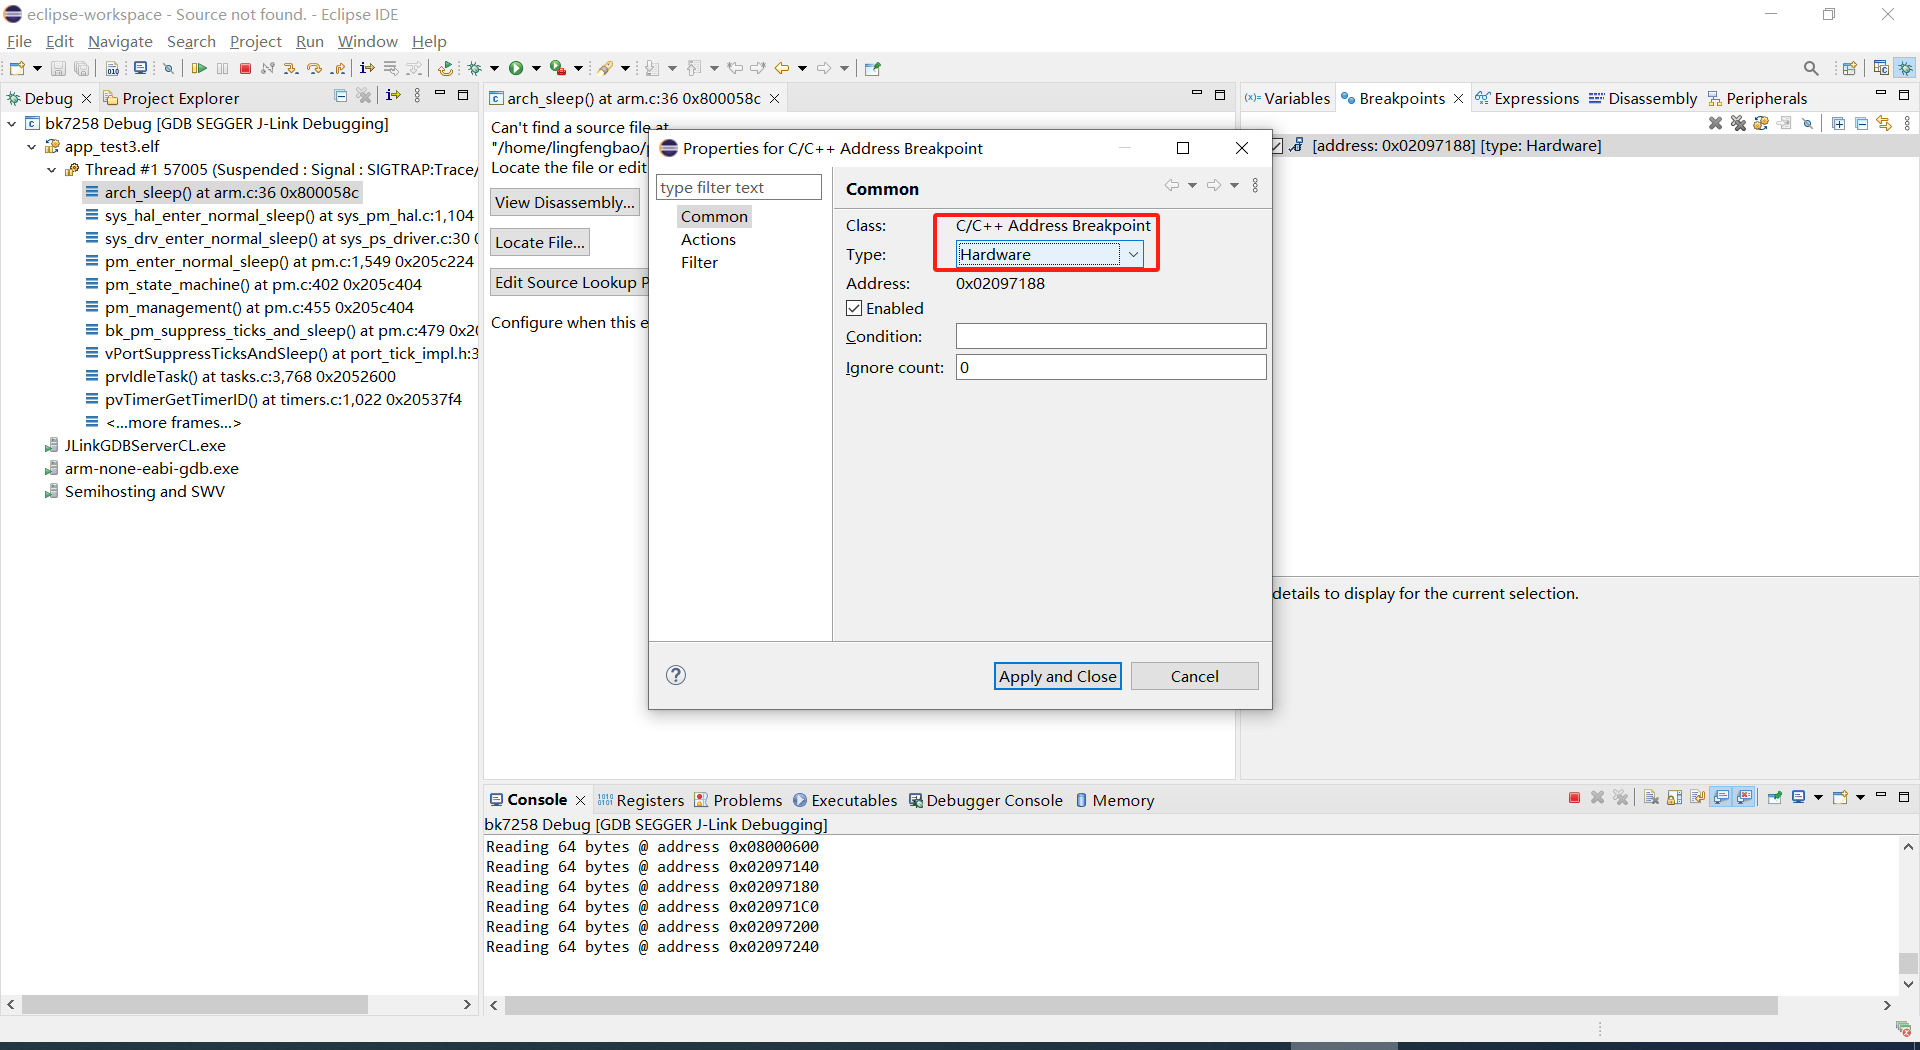
To establish a SWD debugging connection using Jlink, a DEBUG version of the code must be compiled.
If the system is not booting normally, attempting to connect to Jlink via serial input commands may not be possible.
In this case, you can manually call the following functions in driver_init after bk_gpio_driver_init():
bk_set_jtag_mode(0,0); // The first parameter 0 indicates debugging cpu0, and the second parameter 0 indicates
using the first set of SWD gpio pins while(g_test_mode); // Define a volatile global variable to prevent the compiler from optimizing away the following code
Then, after connecting to Jlink, modify the g_test_mode variable value and continue debugging.
Due to GPIO pin multiplexing, the default version requires entering debug commands or setting debug mode in the code when connecting to Jlink for debugging:
Disable the watchdog
Reconfigure the SWD-related gpio
Important
For the Beken AI development board, direct sending of the setjtagmode command to configure the JTAG connection is not supported, as both pin groups are currently occupied.
You must disable the pin multiplexing function and then manually configure it in the code.
Refer to the following for GPIO configuration:GPIO User Guide
The dump function of Release version is turned off by default and can be turned on through CONFIG_DUMP_ENABLE configuration
BK7258 has CPU0、CPU1 and CPU2, and the dump function can be turned on by modifying the config files of the three CPUs.
The principle of the Dump tool to restore the scene is that the script analyzes the log, parses out the contents of regs, itcm, dtcm, and sram, and then restores these contents to the qemu virtual machine through gdb
Log file suffix supports txt, log, DAT
Log file encoding currently only supports utf-8, other encoding formats can be manually converted to utf-8 encoding format through notepad++
If there are multiple Logs in the tool directory, or there are multiple Dumps in the Log, the tool will analyze the last Dump. You need to ensure that there is only one Log in the tool directory, and there is only one dump in the Log.
The Dump tool can automatically remove regular timestamps in the log: [2024-02-03 14:35:13.375193]. If you encounter irregular timestamps, you need to remove them manually.
If two exceptions occur during the dump process, a common example is when detecting memory out of bounds and encountering Assert, the register will be printed one more time. The second register printing needs to be deleted during parsing.
BK7258 Any CPU Dump will dump all the registers of the current CPU, itcm, dtcm, and 640k sram.
By default, the Log and Dump of BK7258 cpu0 are output through UART0
By default, the Log and Dump of cpu1 are sent to cpu0 through MAILBOX and then output through UART0
By default cpu2’s Log and Dump are output through UART2
If you encounter two CPUs dumping at the same time during the Dump process, you need to split the Log into two dump files, and use the elf of cpu0 and cpu1 to restore the scene.
Each CPU needs the registers of the current CPU, itcm, dtcm, sram plus elf to restore the scene
>>>>stack mem dump begin, stack_top=20000000, stack end=20004000<<<<stack mem dump end. stack_top=20000000, stack end=20004000
itcm format:
>>>>stack mem dump begin, stack_top=00000020, stack end=00004000<<<<stack mem dump end. stack_top=00000020, stack end=00004000
sram format:
>>>>stack mem dump begin, stack_top=28040000, stack end=28060000<<<<stack mem dump end. stack_top=28040000, stack end=28060000>>>>stack mem dump begin, stack_top=28060000, stack end=280a0000<<<<stack mem dump end. stack_top=28060000, stack end=280a0000>>>>stack mem dump begin, stack_top=28000000, stack end=28010000<<<<stack mem dump end. stack_top=28000000, stack end=28010000>>>>stack mem dump begin, stack_top=28010000, stack end=28020000<<<<stack mem dump end. stack_top=28010000, stack end=28020000>>>>stack mem dump begin, stack_top=28020000, stack end=28040000<<<<stack mem dump end. stack_top=28020000, stack end=28040000
When the system turns on CONFIG_MEM_DEBUG, the Dump process will print out all the Heap memory currently used by the system and check whether there is any memory out of bounds:
Under normal circumstances, task-related information will also be dumped to the log for reference during problem analysis.
analysis of stability issues of Armino platform BK7258 system
Embedded stability problems are a common but difficult to locate problem,
which have the following characteristics:
Unpredictability:The time point of system failure is not fixed and difficult to predict.
It may occur suddenly after a long period of operation.
Diversity:problems can appear in many forms such as crashes,freezes,lags or erroneous behavior.
Cumulative effect:The longer the system runs,problems such as resource leakage or data corruption
may accumulate,eventually leading to a crash.
Environmental dependence:stability may also be affected by environmental factors such as temperature,
humidity and power supply ripple.
In order to help users better locate stability problems,the following linked documents provide common analysis methods.
Note
This document only addresses stability issues caused by the software. It is recommended that users refer to
this document first when encountering stability issues.